In the home page in the new v3.2.0 you may notice a new line under the Survey Documentation link:
Summary: CSV or Plot
You can click on CSV to download a table of the information on all SkyView surveys. If there are multiple ranges of epoch, the epoch given will be from the beginning of the first range till the end of the last.
If you click on Plot you can easily make plots of the information like
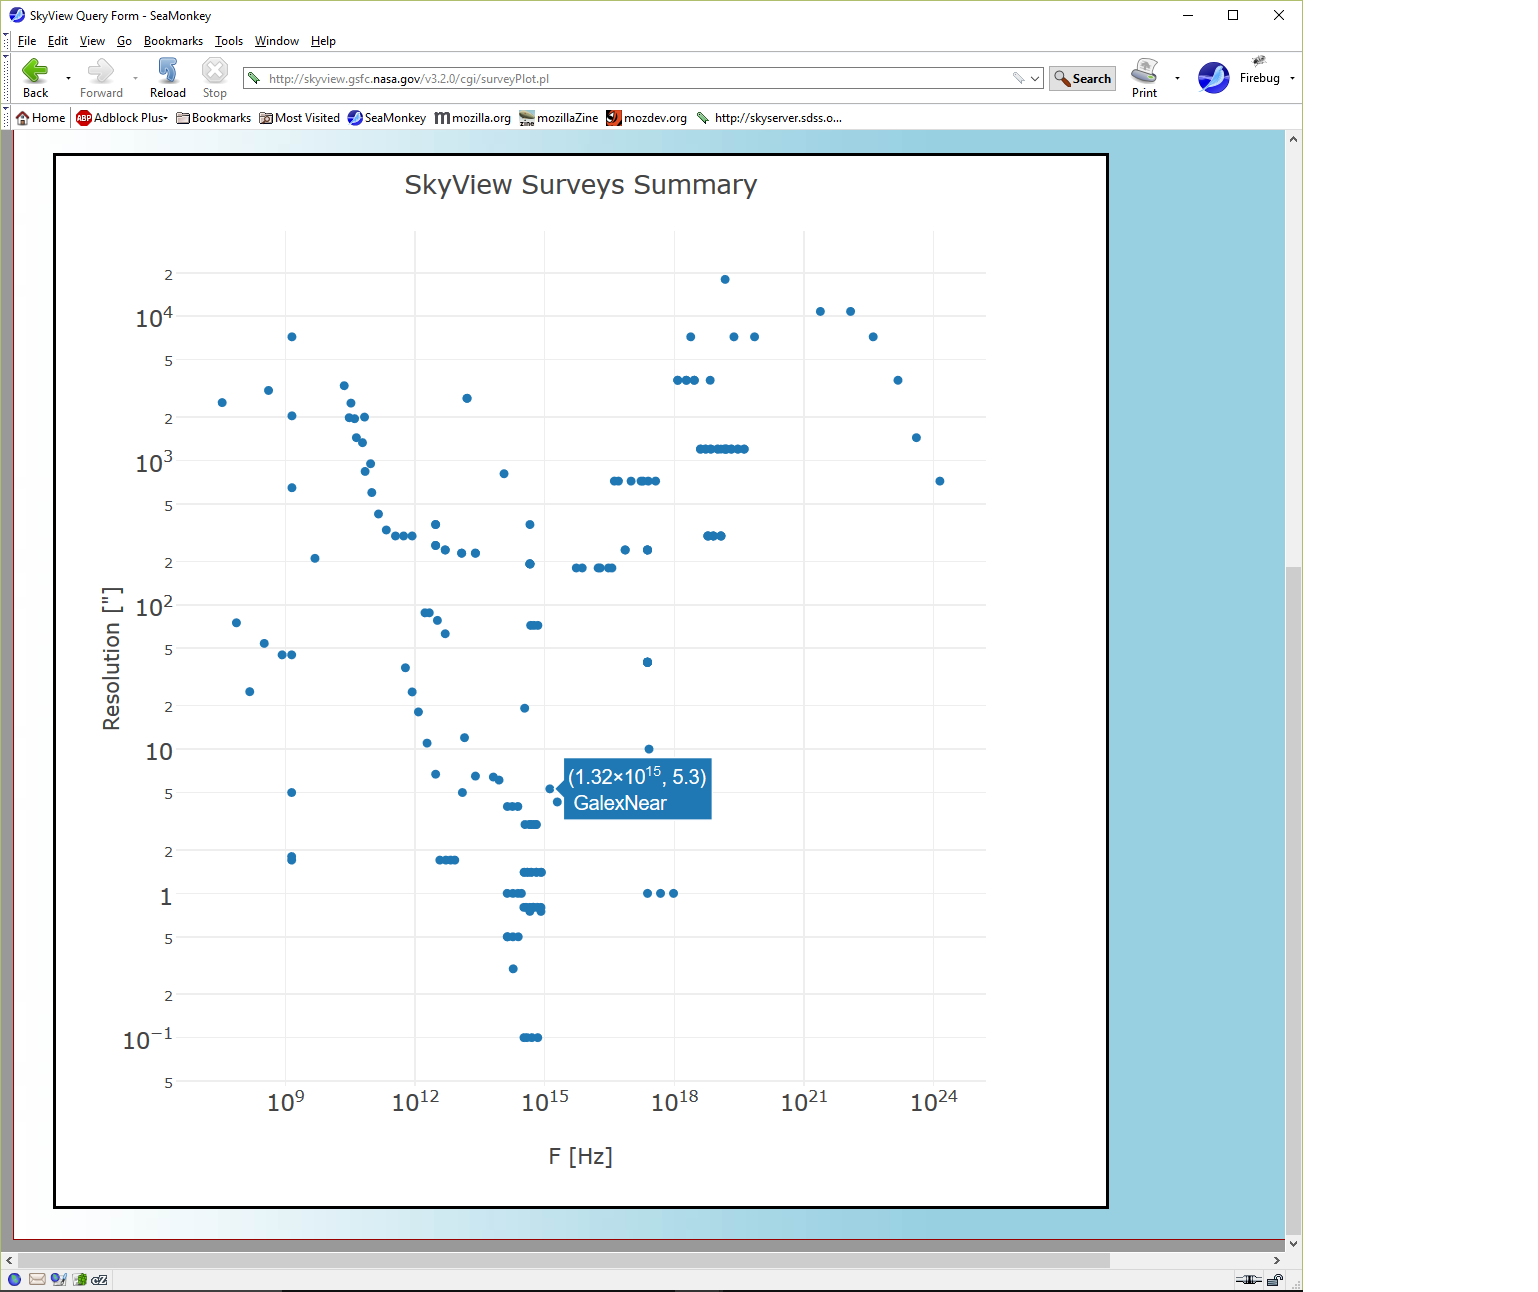
You can just mouse around in the plot to see which survey corresponds to which point. Here the mouse happened to be near the GALEX NUV survey point. Or you can pick a different X or Y axis and see how SkyView surveys are distributed in time, energy, resolution and coverage.
These plots use the Plotly plotting package.