One of the images that had gotten temporarily concealed in our Gallery was
DSS2 Red: 2nd Digitized Sky Survey (Red)

| Center: | 12 53 36, -60 20 00 |
| Created: | 2009-10-20 02:48:39 |
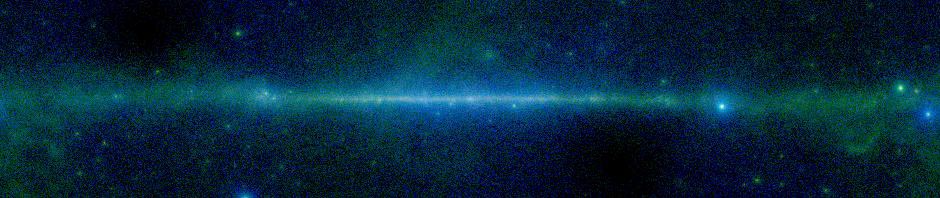
There are a couple of weird things going on here. There’s a galaxy which seems to be cut off with a sharp edge. And the quality of the image seems to change abruptly along two lines. What’s going on here?
This is a DSS2 image. The DSS2 survey data are Schmidt plates, about 6 degrees on a side. Especially in the southern hemisphere there’s a fair bit of overlap on the plates, and a single region may be covered by multiple images. For each pixel SkyView uses the image where that pixel is the furthest from the edge of the plate. It looks like this region has data from at least 3 plates. What we are seeing is the boundaries between the plates. The image in the top right corner is deeper than the one on the center, so that it shows the outer region of the galaxy while the central image only shows the core.
Usually SkyView does a better job of joining DSS2 images. Since the 0 point of the plates is pretty arbitrary, SkyView normally looks at the image boundaries and adds an offset to each image so that as we go from one image to another the median shift is 0. This ‘Edge reduction’ option can be turned off. For most surveys that’s the default, but it is turned on by default for some of the optical surveys including the DSS. If we turn it off the image becomes

The boundaries are even more pronounced now. In this case maybe that’s better, since it makes it clearer what’s going on. Most of the time, though, the Edge reduction does a pretty good job of matching the images. The problems tend to arise when there are strong intensity gradients over one or more of the images. We’re only matching a 0 point and not a slope so even if these intensity gradients are real rather than some background effect, the slopes in the different images may not match.
Tom. You know know where the plate boundaries on the DSS are? That is : the system joins the plates? I thought the DSS was a one file thing like the Plan(c)k. If skyview ( not related to sky net ) has knowledge of the exact limit between plates, I sure could due that information, particularly of it can be served as a vector file. I have to generate or guesstimate where the plate boundaries are in order to create a mask to flatten the field manually. It provides continuity which I need to refine the ism signal . In photoshop the information I am referring to is called a vector mask . It’s post script ( I think )
The blog post says that sky view ( not related to sky net ) joins the plates and it does a job of this . Every time I encounter a poorly matched boundary, almost always , nothing less than perfection is desired here, I find my self laboring to emphases the boundary.
The vector mask is used to burn and dodge the plate into flatness . Getting the boundary masked is repetitive task, that the machine is already aware,numerically. it should not be to difficult to generate a file , a PostScript file that relays boundary information to the user . And I may be the only user . That’s not so good. On the other hand. The length of time needed to rectify the field flatness at plate boundary for clean joints could be cut in half or more if the boundaries are machine generated. It implies that the whole survey could be fixed. More easily than I thought . IAC