With the inclusion of multiple GOODS surveys we thought it might be useful to take a look at the overall properties of SkyView surveys. So here’s a summary of what we have in a few graphs.
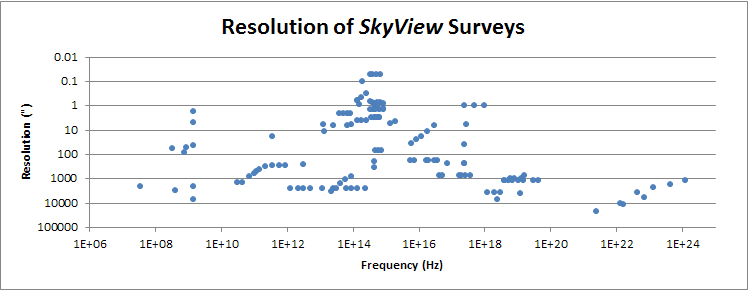
With the addition of the HST ACS data we now have resolutions better than 0.1″ for some surveys.
The relatively miniscule coverage of the GOODS surveys is manifest in this plot.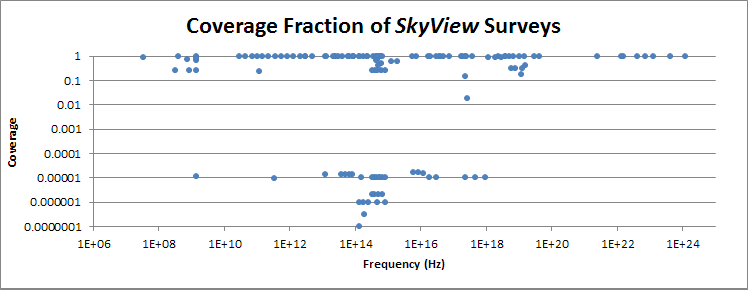
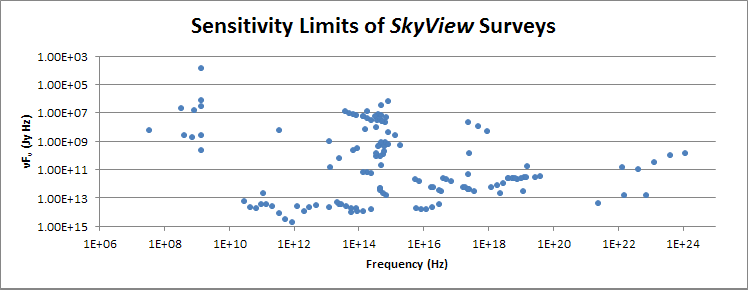
The sensitivity (here the product of the frequency and the limiting flux in Jy) is shown here